What
What is a Claude mod?
Claude Code shipped something called mods. A mod is a small TypeScript function inside a plugin, and it hooks into Claude Code itself.
It can do four things:
And the part that matters most: you don't have to write it. You describe it in a sentence. Claude writes it, and loads it into the session you're already in.
Why
Why mods?
Until now, everyone using Claude Code had the same tool. Same buttons, same commands, same defaults. The only difference between you and the next person was what you typed.
Mods break that. The tool itself can now take the shape of how you work.
Anthropic was never going to build a button for your exact workflow. That's the point. Mods are for the things too specific to your work for anyone else to build.
And here's where the margin moves. When everyone has the same model, the model stops being the advantage. What's left is your process: the way you brief, the way you check, the way you hand off. A mod turns that process into something the tool does for you. Every time. Without you remembering.
Where
Where do you use them?
Two answers: where they run, and where they earn their keep.
Where they run
In Claude Code in the terminal and in the desktop app, from version 2.1.287.
Where they earn their keep
Anywhere you keep doing the same thing by hand. Match it to the four things a mod can do:
- Draw UI. The Claude Code team's own example is a bar above the prompt that shows how full your context window is, one colour per category.
- Add a command. That same mod made up its own command,
/context-bar, to switch it on and off. - Hold or rewrite a tool call. The check you always forget before something goes out, run every time, before Claude acts.
- Replace a built-in. If a default doesn't fit how you work, you swap it for your own version.
One you can switch on already: "You should know"
A small side agent reads along while Claude works, and taps you on the shoulder when it spots something either of you missed. It's built in, but you have to switch it on:
/plugin enable cc-plugin-you-should-know@builtin
Run it inside Claude Code. According to the Claude Code changelog it works in first-party sessions with telemetry on.
Last one. You can now publish plugins to the Claude directory, so a mod that works for you can reach everyone using Claude, not just Claude Code.
How
How do you make one?
Four steps.
-
Check your version
You need Claude Code 2.1.287 or newer.
Terminalclaude --version
-
Pick the one thing you repeat most, and describe it
Start with "Create a mod that…" and finish it with your most annoying daily task. These are the two mods built in the video. Both were tested on Claude Code 2.1.289.
Starter mod 1: email pillscreate a mod that hides every email address as a pill, and shows one only when I hover it
What you get: every email address in Claude's replies is shown as a pill, and one is revealed when you hover it. That means you can screen-share a client list without flashing a single contact.
Good to know: it covers Claude's message text, not tool output, and it's a visual mask, so the address can still be copied. Claude builds it fresh each time, so your pills may look different from the ones in the video.
Starter mod 2: context barcreate a mod that draws my context window as a stacked bar above the prompt, toggled with /context-bar
What you get: a bar above the prompt showing how full your context window is as a percentage, with a coloured segment per category (system prompt, tools, MCP, skills, messages) and a legend.
Good to know: the mod makes up its own command,
/context-bar, to switch the bar off and on. The bar starts switched on. -
Let it build
When Claude asks whether to turn on hot reloading for this session, say yes. The mod loads straight into the session you're in, with no restart.
-
Try it
If it's not quite right, tell Claude what to change. If it saves you time, keep it. If it saves you an hour a day, publish it.
Before you build anything this week: run a prompt audit
Opus 5.5 and Sonnet 5.5 just landed, so your old instructions were written for older models. Run checkup, prompt audit.
/checkup prompt-audit .
It reads your CLAUDE.md files, your skills, agents and custom commands. It flags instructions written for older models, stale paths, and rules that contradict each other.
It changes nothing until you say so. You get a report and a proposed diff right in the terminal, and you decide which changes to take. No files are written.
The . at the end points it at the current folder. Without a path it also audits ~/.claude/skills and your plugins.
Build something serious
The prompt anatomy
A dashboard is only useful if it answers one decision for one person. So every prompt below is built from the same eight parts, and the parts in [SQUARE BRACKETS] are where you put your own business in. Copy the shape, not the words.
What a dashboard mod is, technically (checked against the 2.1.289 mod API): a plugin that registers a slash command, opens a Pane (a side panel in the terminal or desktop app), reads your data with $.fs (a local CSV or JSON file) or $.http.fetch (a URL), redraws on a $.clock timer, and draws everything as text: numbers, block-character bars, sparklines. It can also call $.model to write one sentence about the numbers. It only reads data. Nothing in these prompts lets it change your files, accounts or money.
| # | Part | What it does | If you skip it |
|---|---|---|---|
| 1 | Who and which decision | Names the person looking at it and the one decision it informs | You get a wall of numbers nobody acts on |
| 2 | Data source | Exact file or URL, its columns, how often it changes | Claude guesses the format and the mod breaks on real data |
| 3 | Metric definitions | Every number with its formula | "Conversion rate" means three different things in three tools |
| 4 | Layout, in reading order | What sits at the top, middle and bottom | The most important number ends up below the fold |
| 5 | Thresholds | When a number turns amber or red | Everything looks equally urgent, so nothing is |
| 6 | Interaction | Commands, filters, refresh | You end up opening the file anyway |
| 7 | The one-line read | Optional: one sentence on what changed and what to check | You're left doing the interpreting yourself every time |
| 8 | Guardrails | Read-only, never invent a number, show gaps | A dashboard that fills gaps with guesses is worse than none |
Rule of thumb: if you can't fill in part 1 in one sentence, you don't need a dashboard yet. You need a question.
Dashboard 1 · /mkt
Marketing performance dashboard
Verified on Claude Code 2.1.289
For: a marketer or founder deciding, every morning, where the next unit of budget goes.
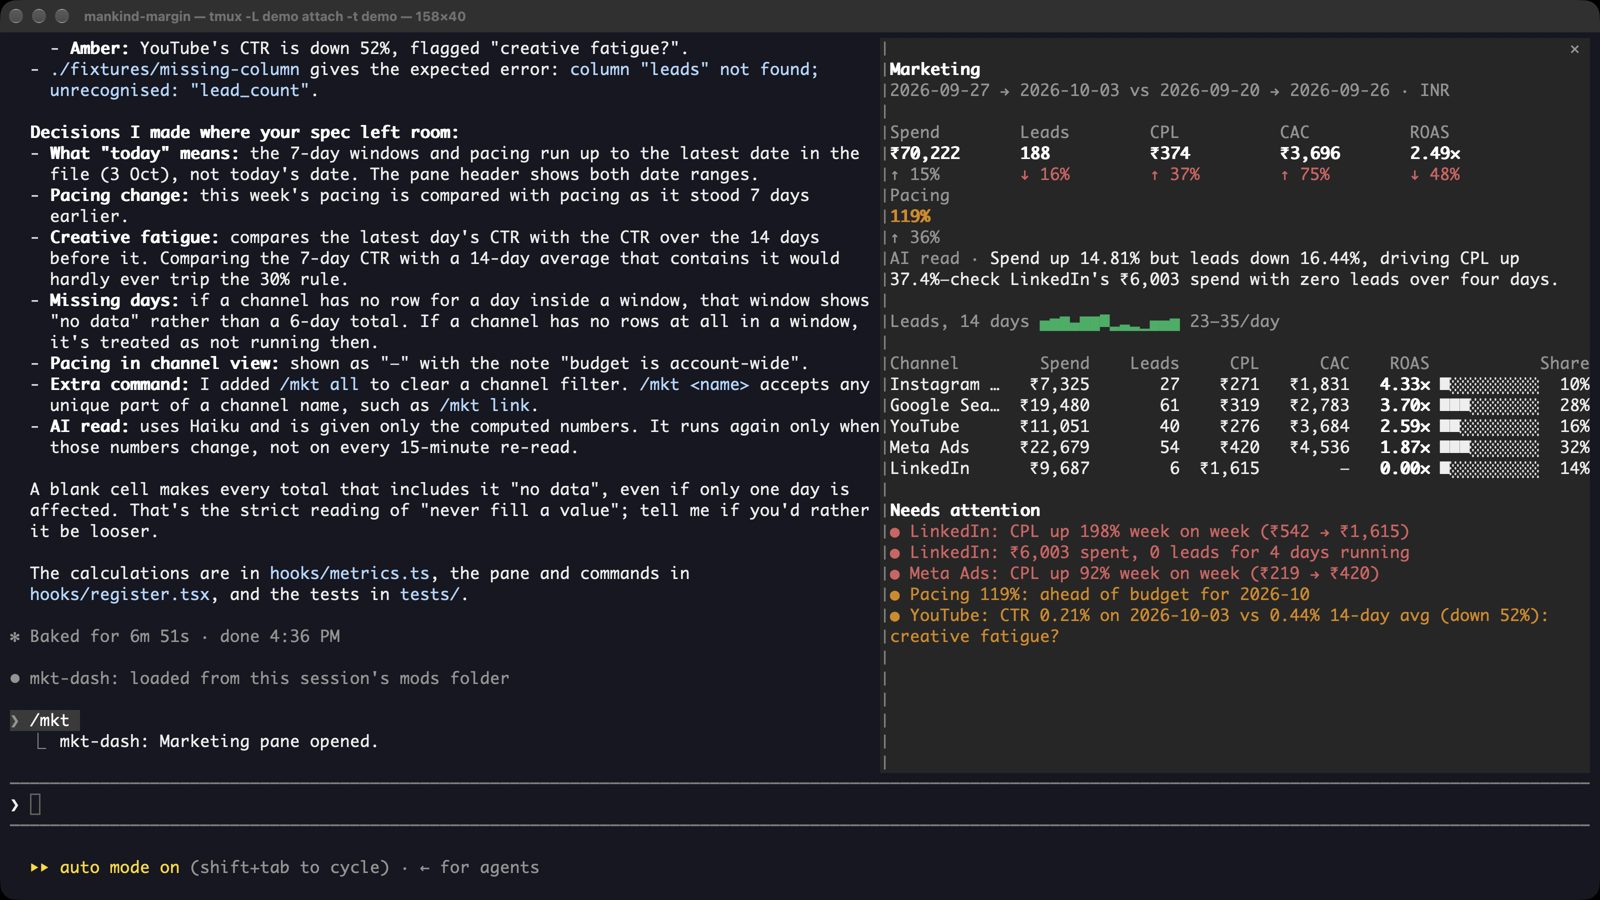
Create a mod called mkt-dash: a marketing performance dashboard that opens in a side pane with /mkt.

WHO AND WHICH DECISION
It is for [the marketing lead] deciding each morning [which channel gets more budget, which gets less, and which ad needs a new creative].

DATA
Read [./data/marketing-daily.csv]. One row per day per channel (some exports call it ad network) with columns:
date, channel, spend, impressions, clicks, leads, customers, revenue.
[Our currency is INR. The month's total budget is 3,00,000, set in ./data/budget.json as {"month_budget": 300000}.]
Re-read the file every [15 minutes] and when I run /mkt refresh.

METRICS (compute exactly like this)
- CTR = clicks / impressions
- CPL (cost per lead) = spend / leads
- CAC (cost per customer) = spend / customers
- ROAS = revenue / spend
- Lead-to-customer rate = customers / leads
- Pacing = month-to-date spend / (month budget × days elapsed / days in month)
Show each for [the last 7 days], with the change against the 7 days before.

LAYOUT (top to bottom)
1. One row of tiles: Spend, Leads, CPL, CAC, ROAS, Pacing. Each tile: value, arrow, % change.
2. A 14-day sparkline of [leads] under the tiles.
3. A table by channel, sorted by [ROAS] (best first): spend, leads, CPL, CAC, ROAS, a 10-character bar of share of spend.
4. A "needs attention" list (see thresholds). If nothing qualifies, say "Nothing needs you today."

THRESHOLDS
- Pacing above [110%] or below [85%]: amber.
- A channel whose CPL rose more than [25%] week on week: amber. Over [50%]: red.
- A channel with spend but zero leads for [3] days running: red.
- CTR down more than [30%] against its own 14-day average: flag "creative fatigue?".

INTERACTION
/mkt opens or closes the pane. /mkt [channel name] shows that channel only. /mkt refresh re-reads now.

ONE-LINE READ (optional)
Under the tiles, one sentence from the model: the biggest change this week and the one thing to check first. Give it only the computed numbers, never the raw file. Mark it "AI read".

GUARDRAILS
Read-only. Never estimate or fill a missing value. Show "no data" instead, and name the missing column.
If the file is missing or a column is misnamed, the pane says which, in one line, instead of drawing zeros.
Show the date range and currency on the pane header.
Write a test with a small fixture CSV that checks CPL, ROAS and pacing.
Why it's written this way
- Part 1 forces a decision. "Where the next unit of budget goes" is why channels are sorted by ROAS and why pacing is a top tile.
- The formulas are spelled out because Meta, Google and GA4 each count a "conversion" differently. Your dashboard should count it one way: yours.
- Week-on-week change beats totals. A CPL of 400 tells you nothing. A CPL that went from 300 to 400 tells you to act.
- "Creative fatigue?" has a question mark on purpose. The data can't prove fatigue. It can only point you at the ad to check.
Make it yours
Change the parts in [square brackets] before you paste.
| If you are… | Change these slots |
|---|---|
| A clinic or local service | leads → booked appointments; decision → "which campaign fills next week's slots" |
| SaaS | customers → trials started and paid conversions; add payback months = CAC / monthly revenue per customer |
| An agency running many clients | Add a client column; /mkt [client]; sort clients by pacing risk |
| Content creator | Channels → platforms; spend → hours; leads → followers gained; ROAS → revenue per hour |
Dashboard 2 · /team
Team performance dashboard
Verified on Claude Code 2.1.289
For: a team lead deciding, every Monday, who needs help and what to stop taking on.
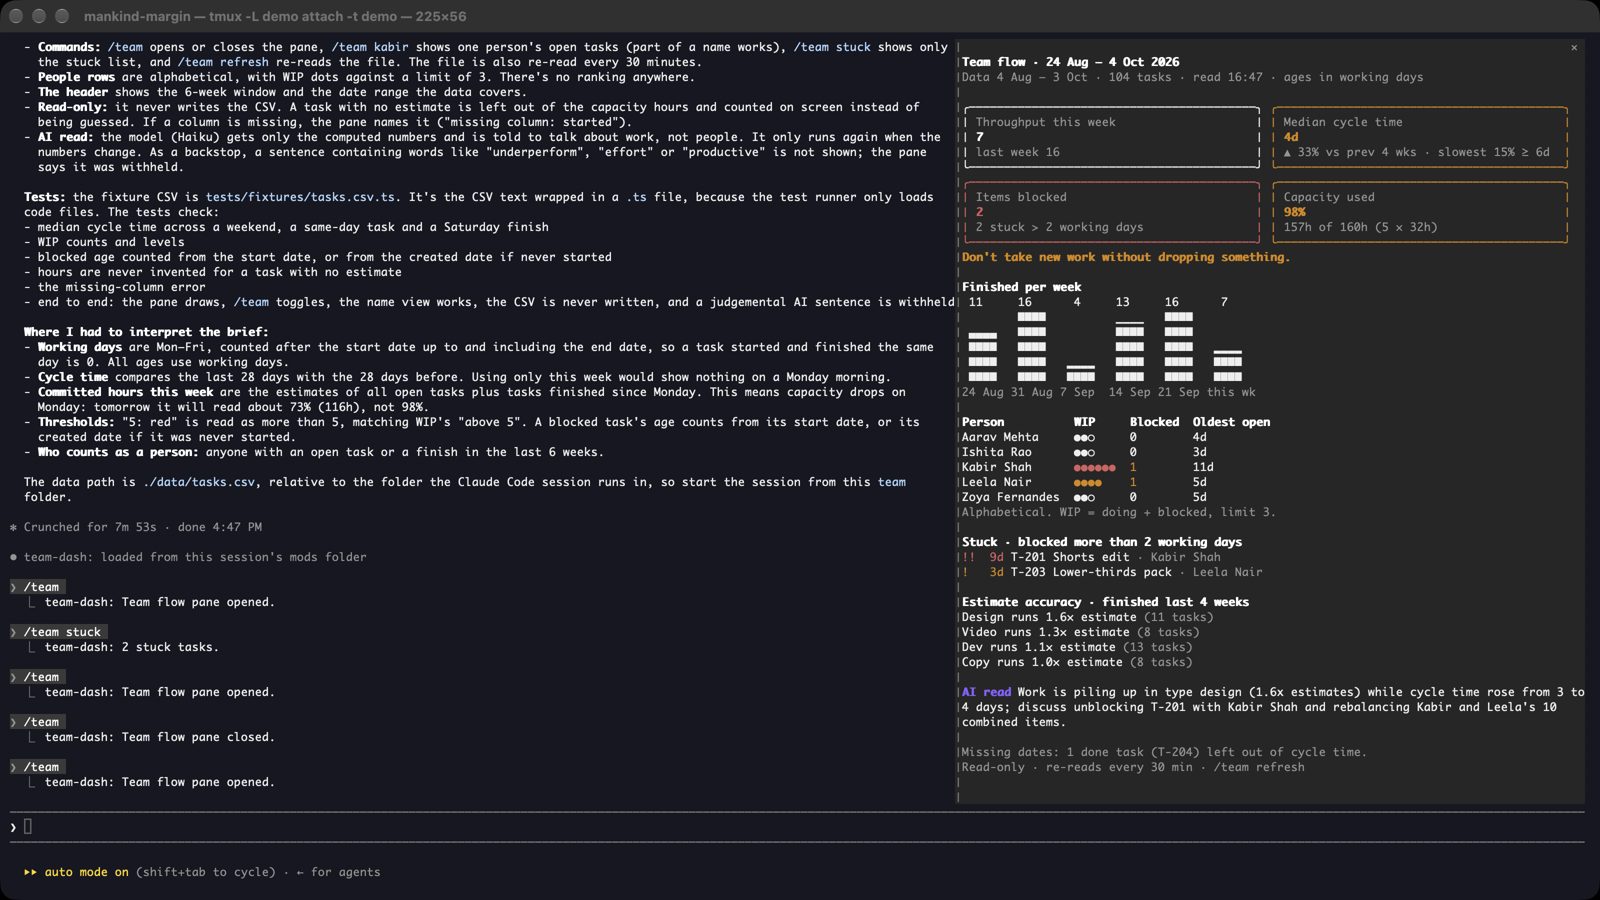
Create a mod called team-dash: a team flow dashboard that opens in a side pane with /team.

WHO AND WHICH DECISION
It is for [the team lead] deciding each [Monday] [who is overloaded, what is stuck, and whether we can take on new work this week].
It measures how work flows through the team, not how good each person is. Do not rank people. No leaderboard.

DATA
Read [./data/tasks.csv] with columns:
id, title, owner, status (todo | doing | blocked | done), created, started, finished, estimate_hours, actual_hours, type.
Dates are ISO. Re-read every [30 minutes] and on /team refresh.

METRICS (compute exactly like this)
- Throughput = tasks finished per week, last [6] weeks
- Cycle time = finished − started, in working days; show median and the slowest 15%
- Work in progress (WIP) per person = tasks in doing + blocked
- Blocked age = days since a blocked task was last started or created
- Estimate accuracy = sum(actual_hours) / sum(estimate_hours) for tasks finished in the last [4] weeks, per type
- Capacity check = this week's committed estimate_hours / [32] hours × people

LAYOUT (top to bottom)
1. Tiles: Throughput this week, Median cycle time, Items blocked, Capacity used %.
2. A 6-week throughput bar chart, one bar per week, in block characters.
3. A row per person: WIP as filled dots against the limit [●●●○], tasks blocked, oldest open task age. Alphabetical, never sorted by output.
4. "Stuck" list: every blocked task older than the threshold, with owner and age.
5. Estimate accuracy by task type ("Design runs 1.6× estimate").

THRESHOLDS
- WIP above [3] for a person: amber. Above [5]: red.
- Blocked for more than [2] working days: amber; [5]: red.
- Capacity above [90%]: amber, with the line "Don't take new work without dropping something."
- Cycle time median up more than [30%] against the previous 4 weeks: amber.

INTERACTION
/team opens or closes the pane. /team [name] shows one person's open tasks. /team stuck shows the stuck list only.

ONE-LINE READ (optional)
One sentence from the model on where the work is piling up and the single conversation to have this week. Give it computed numbers only. Mark it "AI read". It must never describe a person's performance or effort.

GUARDRAILS
Read-only. If a task has no started date, leave it out of cycle time and count it under "missing dates".
Never invent hours. Show the date range on the header.
Write a test with a fixture CSV that checks median cycle time, WIP counts and blocked age.
Why it's written this way
- "Don't rank people" is in the prompt because a mod will happily build a leaderboard if you don't say no. Leaderboards measure who picks easy tasks. Flow data shows where the system is jammed.
- Cycle time uses the median and the slowest 15%. One monster task wrecks an average. The slow tail is where your process breaks.
- Estimate accuracy is per task type, not per person. "Design runs 1.6× estimate" fixes planning. "Priya runs 1.6×" fixes nothing.
- The capacity line tells you what to do, not just a percentage.
Make it yours
Change the parts in [square brackets] before you paste.
| If you are… | Change these slots |
|---|---|
| A support team | tasks → tickets; add first-response time; decision → "where to move people this shift" |
| An agency | Add client; capacity per client against the hours each client pays for |
| Engineering | Data from your tracker's CSV export or API URL via $.http.fetch; type → bug / feature / chore |
| A solo creator | owner → stage (script, shoot, edit); decision → "which stage is my bottleneck" |
Dashboard 3 · /shop
E-commerce product performance dashboard
Verified on Claude Code 2.1.289
For: a store owner deciding, every week, what to reorder, what to push, and what to clear out.
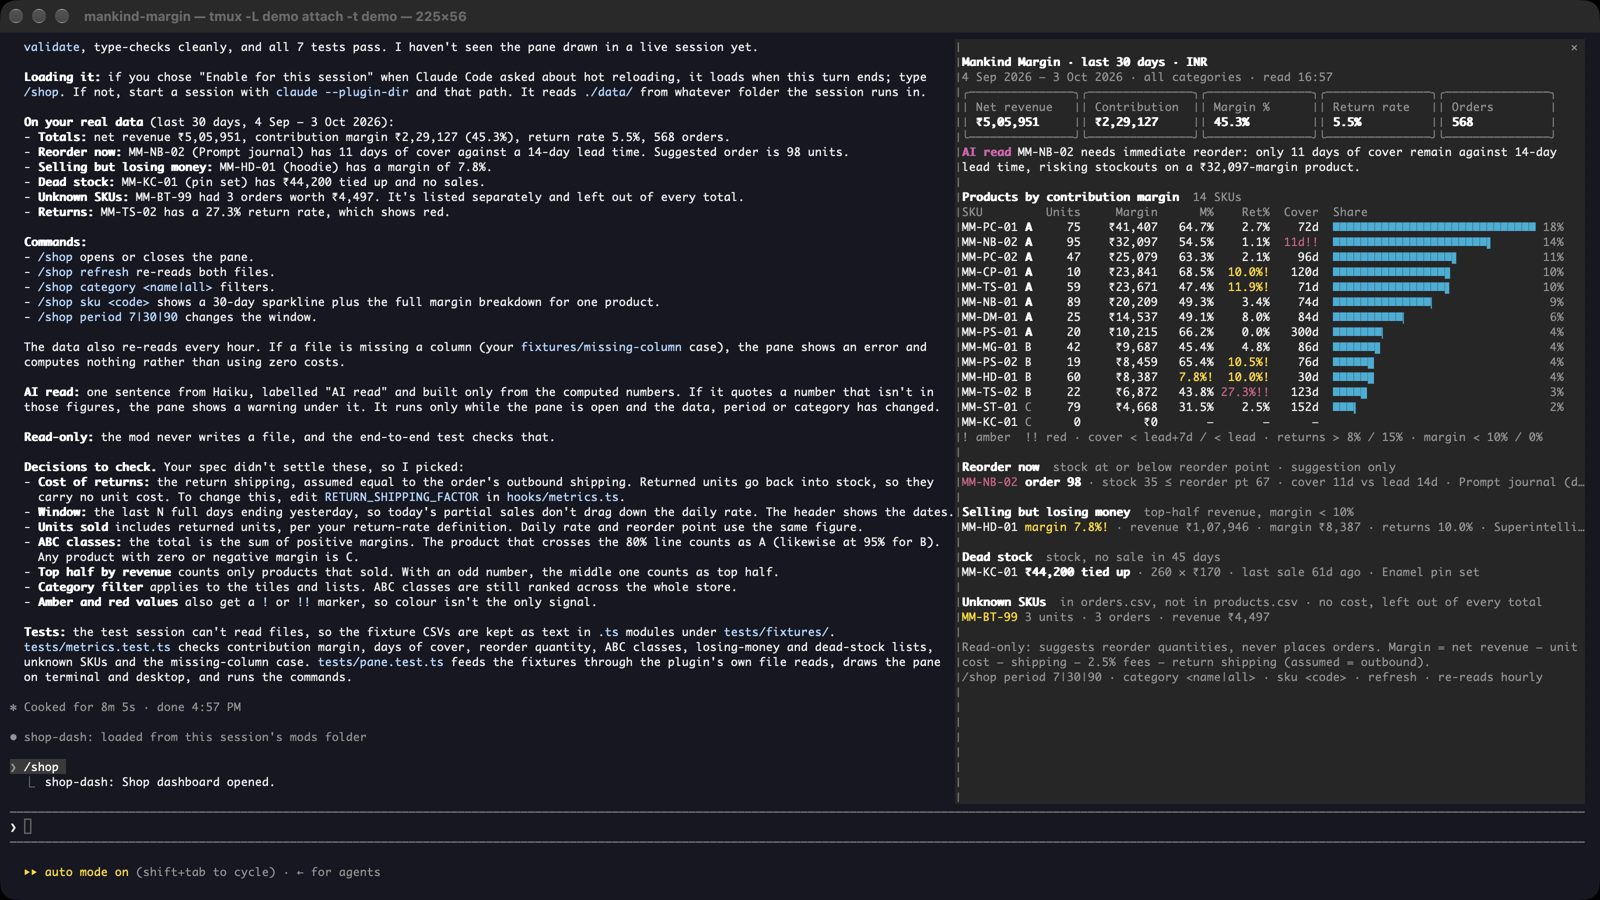
Create a mod called shop-dash: a product performance dashboard that opens in a side pane with /shop.

WHO AND WHICH DECISION
It is for [the store owner] deciding each [week] [what to reorder, which products to promote, and which to discount or drop].

DATA
Read two files:
- [./data/orders.csv]: order_id, date, sku, qty, unit_price, discount, shipping_cost, returned (true/false)
- [./data/products.csv]: sku, name, category, unit_cost, stock_on_hand, lead_time_days
Payment fees are [2.5%] of revenue. Currency [INR]. Re-read every [hour] and on /shop refresh.

METRICS (per SKU, last [30] days unless I say otherwise)
- Net revenue = sum(qty × unit_price − discount) for orders not returned
- Contribution margin = net revenue − (qty × unit_cost) − shipping_cost − payment fees − cost of returns
- Margin % = contribution margin / net revenue
- Return rate = returned units / units sold
- Daily sales rate = units sold / days in period
- Days of cover = stock_on_hand / daily sales rate
- Reorder point = daily sales rate × (lead_time_days + [7] safety days)
- ABC class: sort SKUs by contribution margin; A = top 80% of total margin, B = next 15%, C = last 5%

LAYOUT (top to bottom)
1. Tiles: Net revenue, Contribution margin, Margin %, Return rate, Orders.
2. A table of SKUs sorted by [contribution margin], with class A/B/C, units, margin %, return rate, days of cover, and a bar of margin share.
3. "Reorder now": SKUs at or below their reorder point, with suggested quantity = reorder point × 2 − stock_on_hand.
4. "Selling but losing money": SKUs with revenue in the top half and margin % below [10%].
5. "Dead stock": SKUs with stock but no sale in [45] days, with the cash tied up = stock × unit_cost.

THRESHOLDS
- Days of cover below lead_time_days: red. Below lead time + safety: amber.
- Return rate above [8%]: amber; [15%]: red.
- Margin % below [10%]: amber; below 0: red.

INTERACTION
/shop opens or closes. /shop [category] filters. /shop sku [code] shows one product's 30-day sparkline and numbers. /shop period [7|30|90] changes the window.

ONE-LINE READ (optional)
One sentence from the model: the product most worth attention this week and why, from computed numbers only. Mark it "AI read".

GUARDRAILS
Read-only: it suggests reorder quantities, it never places orders.
A SKU in orders but missing from products.csv is listed under "unknown SKUs", never given a zero cost.
Show the period and currency on the header.
Write a test with fixture files that checks contribution margin, days of cover and ABC classes.
Why it's written this way
- Contribution margin, not revenue, is the sort order. The best-seller is often the product losing you money once you count shipping, fees and returns. That's why "Selling but losing money" has its own section.
- Days of cover is compared with lead time. Ten days of stock is fine if your supplier ships in three days, and a crisis if they ship in twenty.
- Dead stock is shown in money tied up, because "34 units" doesn't get anyone moving. "₹1.2 lakh sitting on a shelf" does.
- Unknown SKUs are never treated as zero cost. A missing cost that quietly becomes zero makes a product look 100% margin.
Make it yours
Change the parts in [square brackets] before you paste.
| If you are… | Change these slots |
|---|---|
| D2C on Shopify | Point the files at your Shopify order and product exports; add channel (site, Amazon, retail) |
| Restaurant or café | SKU → menu item; unit_cost → plate cost; lead time → prep; dead stock → items that waste ingredients |
| Digital products | Drop stock and reorder; add refund rate and revenue per visitor |
| Wholesale / B2B | Add customer; margin by customer as well as by SKU |
Dashboard 4 · /fin
Financial analysis dashboard
Being tested
This prompt is being built and checked for real before we call it verified. Treat it as a draft until this label changes.
For: a founder or finance lead deciding, every month, how long the cash lasts and where it's leaking.
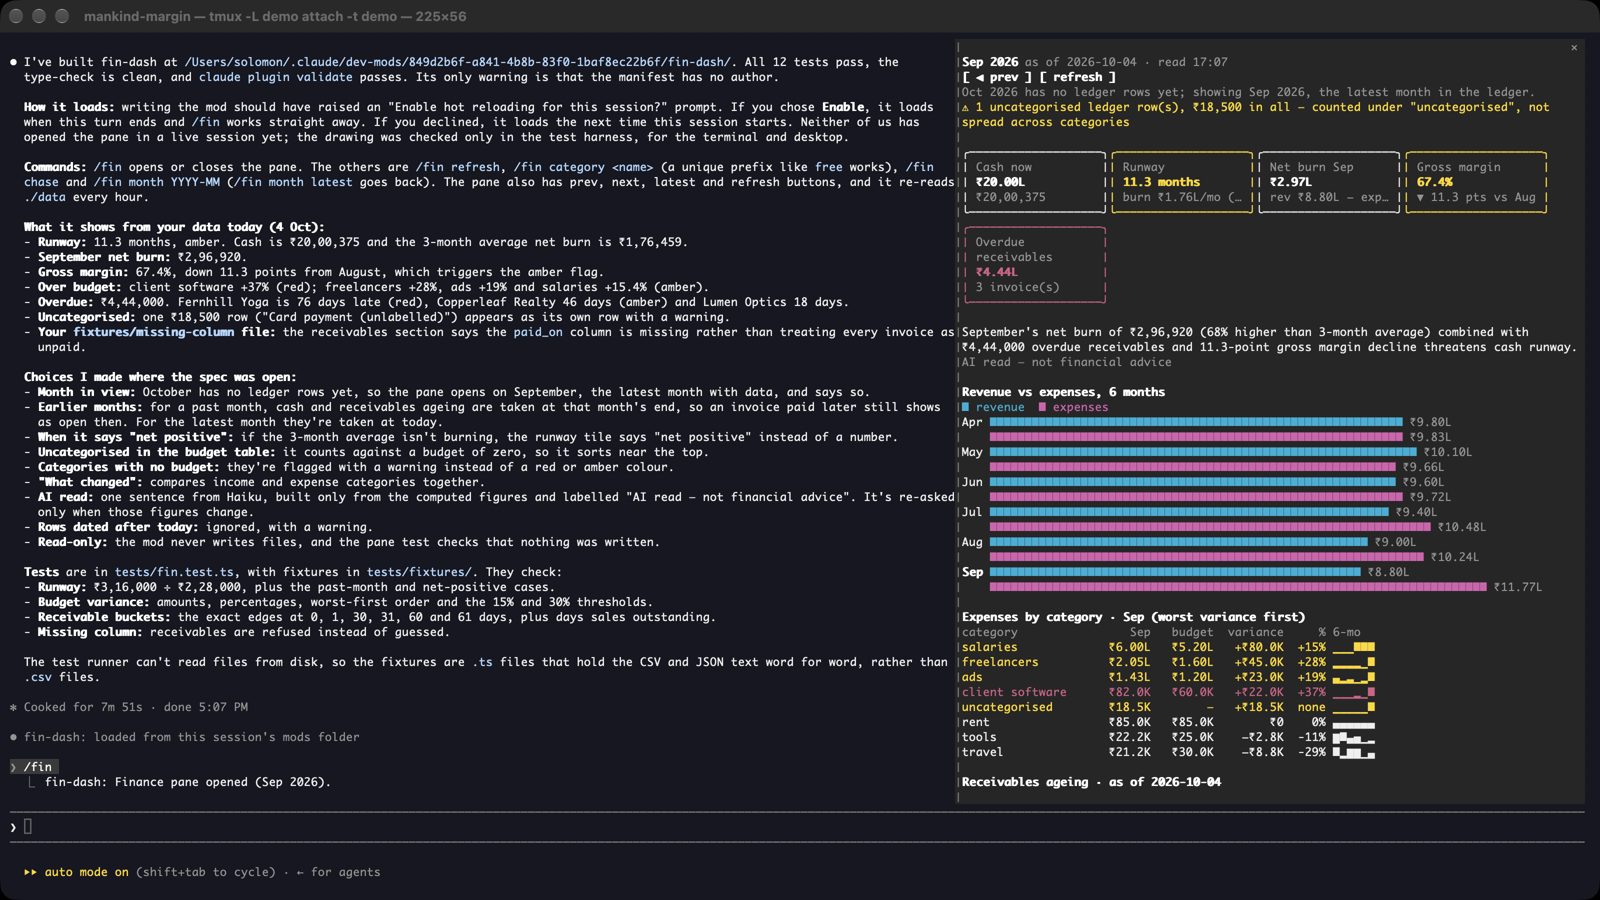
Create a mod called fin-dash: a financial analysis dashboard that opens in a side pane with /fin.

WHO AND WHICH DECISION
It is for [the founder] deciding each [month] [whether we can afford the next hire, which costs to cut, and which invoices to chase].

DATA
Read:
- [./data/ledger.csv]: date, type (income | expense), category, amount, counterparty
- [./data/invoices.csv]: invoice_id, client, issued, due, amount, paid_on (blank if unpaid)
- [./data/plan.json]: {"opening_cash": 2500000, "budget": {"<category>": <monthly amount>, ...}}
Currency [INR]. Re-read on /fin refresh and every [hour].

METRICS (by calendar month, last [6] months)
- Revenue = sum of income; Expenses = sum of expense
- Gross margin = (revenue − [cost of delivery categories: freelancers, software for clients]) / revenue
- Net burn = expenses − revenue (show as "net positive" when revenue is higher)
- Cash now = opening_cash + all income − all expenses to date
- Runway months = cash now / average net burn of the last [3] months
- Budget variance per category = actual − budget, and %
- Receivables: unpaid invoices bucketed by days past due: current, 1–30, 31–60, 60+
- Days sales outstanding = average days from issued to paid_on, last [90] days

LAYOUT (top to bottom)
1. Tiles: Cash now, Runway (months), Net burn this month, Gross margin %, Overdue receivables.
2. A 6-month chart of revenue against expenses, two block-character bars per month.
3. A table of expense categories: this month, budget, variance, 6-month sparkline. Sorted by variance, worst first.
4. Receivables ageing: one row per bucket with total and count, then the [5] largest overdue invoices with client and days late.
5. "What changed": the three categories with the biggest month-on-month change in money.

THRESHOLDS
- Runway below [12] months: amber; below [6]: red.
- A category over budget by more than [15%]: amber; [30%]: red.
- An invoice more than [30] days past due: amber; [60]: red.
- Gross margin down more than [5 points] month on month: amber.

INTERACTION
/fin opens or closes. /fin [category] shows that category's transactions for the month. /fin chase lists overdue invoices with client and amount. /fin month [YYYY-MM] moves the view.

ONE-LINE READ (optional)
One sentence from the model on the biggest risk to runway this month, from computed numbers only. Mark it "AI read — not financial advice".

GUARDRAILS
Read-only. It never sends reminders, moves money or edits the ledger.
Uncategorised rows are counted under "uncategorised" and shown as a warning, never spread across categories.
Every figure on the pane comes from the files; nothing is forecast unless I add a forecast section.
Write a test with fixture files that checks runway, budget variance and the receivable buckets.
Why it's written this way
- Runway is the headline because it's the one number that turns every other one into a decision: hire, cut or chase.
- Receivables get their own section. Most small businesses that run out of cash were owed money at the time. "/fin chase" turns the dashboard into a to-do list.
- Variance is sorted worst first, so the pane opens on the leak, not the alphabet.
- No forecast unless you ask for one. A dashboard that projects quietly mixes guesses in with the facts. Keep them apart.
Make it yours
Change the parts in [square brackets] before you paste.
| If you are… | Change these slots |
|---|---|
| A freelancer | Drop gross margin; add effective hourly rate = income / hours logged; runway in months of personal costs |
| An agency | Gross margin by client = client invoices − freelancer cost tagged to that client |
| Retail | Add inventory as a cash use; link to shop-dash's dead stock figure |
| A non-profit | income → grants and donations; runway by restricted vs unrestricted funds |
Downloads
Downloads
The finished dashboard mods and their sample data, one zip per dashboard.
Running them on your own data
- Export your data to CSV (or note the API URL). Keep the column names. Put the files in
./data/. - Paste the prompt, then change every bracket before you send it. If you can't fill one in, that's the question to answer first.
- Say yes to hot reloading. Run the command (
/mkt,/team,/shop,/fin). - Check three numbers by hand against your own spreadsheet before you trust the rest.
- Then tighten it: "move ROAS to the first tile", "make blocked red after 1 day". Each change reloads in place.
Needs Claude Code 2.1.287 or newer, in the terminal or the desktop app. Panes open at any width when you run their command.
Also in this update
Also in this update
Three more things landed in the same two weeks, and two of them have a deadline.